Introduction
When we write queries, we tend to think about the internals very little. In the new series of SQL Insider, I shall try to demonstrate what your SQL Server has to go through when you write a specific query, more specifically a specific operator. In the series, we shall try to cover all the important operators in SQL. Our today's SQL participant in SELECT.
SELECT
With the SELECT query, we can select one, some, or all the columns of a SQL table. The typical syntax for SELECT is like this
SELECT * FROM Sales.SalesOrderDetail

SELECT sod.OrderQty, sod.UnitPrice FROM Sales.SalesOrderDetail sod
Please note that we will not be dealing with WHERE clause in today's episode.
Database
We will be using AdventureWorks2019 Database for the demonstration
Important Configuration
We will be setting STATISTICS IO ON like this - SET STATISTICS IO ON;
SET STATISTICS IO ON;
We will turn on Actual Execution Plan to examine the query
SQL Insider
Let's start with SELECT * first
SELECT * FROM Person.Address a
If you inspect the Message Tab -
(19614 rows affected)

Table 'Address'.
Scan count 1, logical reads 346, physical reads 1,
page server reads 0, read-ahead reads 344, page server read-ahead reads 0,
lob logical reads 0, lob physical reads 0, lob page server reads 0,
lob read-ahead reads 0, lob page server read-ahead reads 0.
We got 19,614 rows in return and SQL Server did the following
Scan Count - 1: SQL Server had to Scan the Person.Address Table Once. It's pretty straightforward.
Logical Reads - 346: SQL Server keeps its objects in 8KB pages. let's say, A Database Object (table, view, etc.) is 10 MB in size. SO SQL Server is going to need 10MB/8KB = 1240 pages to store the object data. Logical reads simply mean - How many 8 KB page SQL Server had to scan from Cache? In our case, the number is 346 - 8KB pages.
Physical Reads - 1: Physical reads keep track of how many pages the SQL Server had to read from the Disk? It's interesting that we see only 1 page is read from the Disk. How can SQL Server read 1 page from Disk when it needs 346 pages to read from the cache? This means the data was already there in the cache, so SQL Server didn't need to read from the disk that much.
Read ahead reads - 344 :SQL Server first tries to get the data from it's cache. If it can't find the data in the cache, then it needs to read it from disk, since disk IO is expensive, SQL Server Query Engine may decide to read some additional pages into the cache so that it can run the queries faster the next time if needed. Our SELECT query had 346 logical reads and 1 physical read, so SQL Server did not find everything it needed it to cache, it had to read from disk as well, so Read Ahead Read (RAR) mechanism decided to read ahead 344 more pages in the cache.
WHY Physical reads is less than Logical reads?
In fresh condition, SQL Server has nothing in it's cache. So, when we query over a table, physical reads will be higher. If we run the query next time, we will see fewer physical reads and more logical reads. To test this lets clear our SQL Server Cache first.
DBCC DROPCLEANBUFFERS WITH NO_INFOMSGS
And then run our SELECT * query again.
SELECT * FROM Person.Address a
Now let's look at the Message tab again
(19614 rows affected)


Table 'Address'. Scan count 1, logical reads 346, physical reads 343,
page server reads 0, read-ahead reads 344, page server read-ahead reads 0,
lob logical reads 0, lob physical reads 0, lob page server reads 0,
lob read-ahead reads 0,lob page server read-ahead reads 0.
Look at the Physical Reads - 343, wow. SQL Server had to read everything from DISK to Cache (RAM/Memory) first and then read from the Cache (Logical Reads - 346)
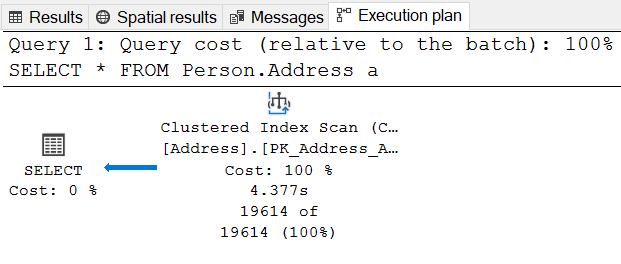
Now let's inspect the execution plan tab.
Here we can see SQL Server is doing a CLustered index scan first on Address Table. Wait, why did we escape the SELECT portion in the execution plan? We did not. The method to read execution plan is to read it from right to left.
Clustered Index Scan - The table Address has a clustered index in it, namely PK_Address_AddressID. In index page, SQL Server stores and manages its index. Since we wrote the query SELECT * , SQL Server Query Engine decided that it's going to scan the primary key index at first and then SELECT the corresponding rows.
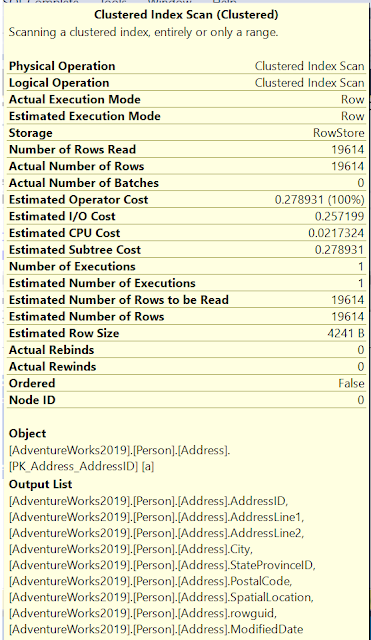
If we hover in the Clustered_Index_Scan, we can see a whole lot of information there.
Physical Operation - It states which physical operations the SQL Query is going to perform.
Logical Operation - It states which logical operations the SQL Query is going to perform. In our case both the logical and physical operation is Clustered_Index_Scan
Estimated and Actual Execution Mode - SQL Server has two execution mode, namely row and batch. In our case SQL Server is going to use Row execution Mode.
Storage - Where SQL Server Query Optimizer is going to store the fetched data, in our case its RowStore.
Number of rows read - How much rows SQL Server had to read
Actual number of rows - How many rows SQL server has returned, it is based on performing WHERE clause on Number of rows read. It can be equal or less than the Number of rows read, since WHERE clasue is likely to filter some data.
Actual number of batches - applicable if the execution mode is batch.
Estimated I/O Cost - Cost of the input/output operation
Estimated CPU cost - Cost that the CPU is going to face, remember the I/O and the CPU cost are the most important cost to be considered apart from memory.
Estimated SubTree Cost - In the execution tree, how much cost is incured for this part of tree
Actual Rebinds - Higher Rebinds is bad. It indiactes how many time SQL Server had to re evaluate the object in order to fetch data. In our case the Rebinds is 0. Great news. But when is the Rebind value higher? When you are using a nested loop, then the inner loop need to re evaluate more than once for every outer loop.
Actual Rewinds - A reqinds occurs when there is no outer reference, meaning the inner join part was resolved using a predicate.
Ordered - This shows if the dataset is in sorted state or not.
Node Id - you can understand in which order the execution plan is fetching data, from right to left and bottom to top.
Now, let's hover our mouse to the SELECT portion of the execution plan.
Cached Plan Size - How much space the plan required in the cache
Degree of Parallelism - How many processors were used by SQL Server to process the request. In our simple SELECT query, we only used 1 processor. Max Degree of parallelism is restrict this value. if Maxdop(1) is selected, the query is going to be executed serially no matter what. Maxdop(0) gives the SQL Server authority to use as many processor it needs to perform faster. Setting optimal Maxdop for the system is very important. I have discussed details on Setting Maxdop and Cost threshhold for SQL Server
Things to remember for SELECT
Please avoid using SELECT *
Why? It consumes a whole lot of memory and CPU than you think.
"Can I use it with my table which has only 4 columns?"
the answer is NO. Write down each of the columns in Select instead of writing * because 2/3 years later, you find out that the table has grown both in row numbers and column numbers (by other developers, and we are not fully aware of the addition, since they were perhaps NULLable fields) and the query you wrote 3 years ago, which needed 4 columns now returns a whole lot of columns which you actually don't need. I have discussed thoroughly Why not use SELECT *
Conclusion
In this episode of SQL Insider, we have discussed What happens inside SQL execution engine when you try to fetch some or all data of a table with SELECT in SQL Server. We have seen What the STATISTICS IO tells us about the details of our SELECT query. We have also seen What the execution plan tells us about our Query
See Also
- How Autogrowth makes your SQL slow and What to do about it
- Why you should understand and set you MAXDOP properly
- Threadpool - A possible issue you have that you dont know


Comments
Post a Comment